Beginners Guide to Google Analytics
Google analytics is plugged into every one of our new websites. It is software provided by Google to keep track of your websites performance. In this article we will show you how to access analytics and start examining the data. The objective of this is to refine your website and make it benefit your business more. By benchmarking and looking at your websites existing performance you can tweak it to improve sales and leads.
So lets get started with accessing Google Analytics.
Accessing Google Analytics.
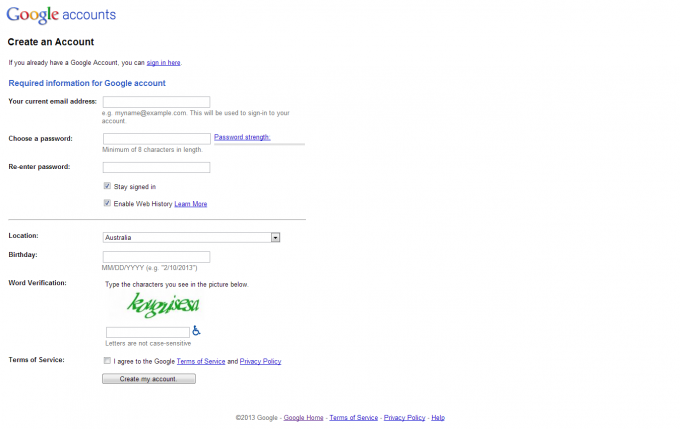
You first need a Google Account to access your analytics reports. This can be an existing gmail account or you can make any email a Google account by going to the following website - Google Account.
Once set up, you can email that address to us and we can give you access to your website reports. Some clients already have taken this step, so please skip to the next stage.
Dashboard
Once you have an account you can log in here- Google Analytics.
This is the main page you will see when you log in. The menu to the left is what we will use to drill down into more data. But first we can look at this summary.
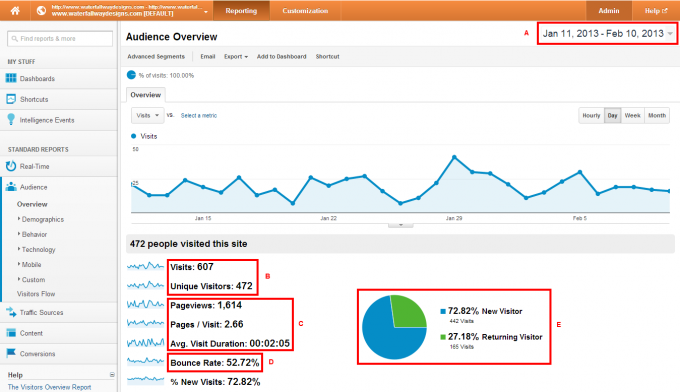
(If you get lost this page can be found under Audience -> Overview).
A: Dates for the report - this section lets you manage when the report is for. Setting the from date and to date. In the photo you can see this report is for one month.
B: Visitors - this shows the total number of visitors to your website, for us it was 607 in the last month. Then unique visitors, these are vistors that have returned during our report period. So of the 607 visitors this month, 472 are unique.
C: Pageviews - this section shows the pages these visitors looked at. They looked at 1614 pages during the month. Averaging 2.66 pages per visit. The duration of the visits were 2.05 minutes.
D: Bounce Rate - the amount of people who visit but leave after only viewing one page. This can include people who came to your site but then immediately left, but also people that came and got what they wanted on the first page. The information they needed like your phone number.
E: New Visitors - This ties into section B and displays the percentage of new visitors and returning visitors.
So even at this stage you can see the benefit of Google Analytics. These are the metrics for your websites performance. You can take steps on your website to improve these results. Compared to next month do you want more visitors? Do you want these visitors to be new or returning for additional information? Do you want to reduce your bounce rate so people stay longer and look at more pages?
Sometimes you can get a bit obsessed with these numbers. You have to establish and keep in mind the overarching objectives of your website. The best metrics for your website are the number of sales or leads the website generates. These Google Analytics metrics should always be used for improving what business your website brings you.
Now to drill a bit deeper into the data.
Traffic Sources
To get to this report I used the left hand menu.
Traffic Sources -> Overview -> Then in the bottom right hand corner of the page I click "view full report".
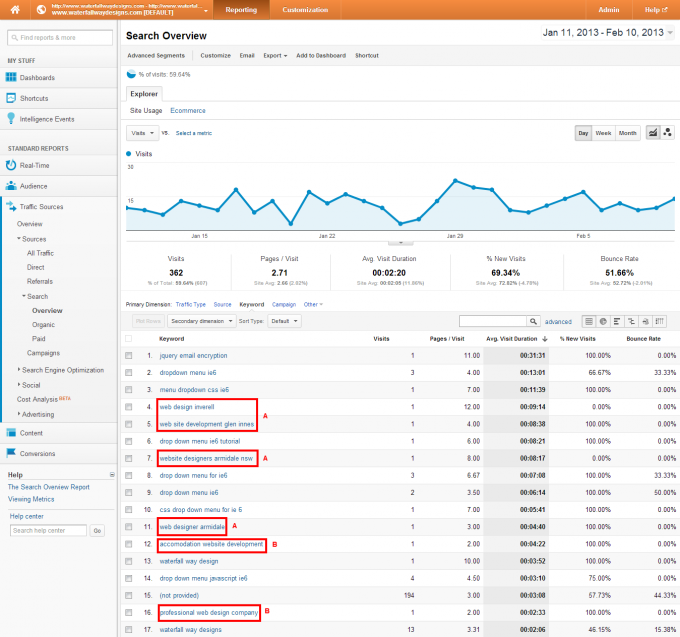
This report shows you what search terms are leading people to your website. For each business the desired search terms will be different. I will identify mine as an example.
A: Regional website development - The "A" sections show search results for people seeking website design in my service area.
- web design inverell
- web site development glen innes?
- website designers armidale nsw
- web designer armidale?
Now for my business I like to have people finding me when searching for these terms. The towns Inverell, Glen Innes and Armidale are local for our web design services.
The next thing to check is that when our website did turn up in their searches the visitors had a look around and found it useful. For "website designers armidale nsw" they looked at 8 pages and stayed for over 8 minutes. To me that means my website is working.
B: Generic web design searches - The second type I have highlighted is for ?general searches in my industry regardless of location. For example one of these is "accommodation website development". So anyone looking for motel websites I turn up. They looked at 2 pages and stayed for 4 minutes.
Defining Your Objectives
So now you see how looking at this data can raise a lot of questions. It is important to examine what you have a website for? What are you hoping it will achieve? Where do you want your business to grow, servicing locals or a larger market? How would you define the success of your website in these terms?
Lets look at some other reports.
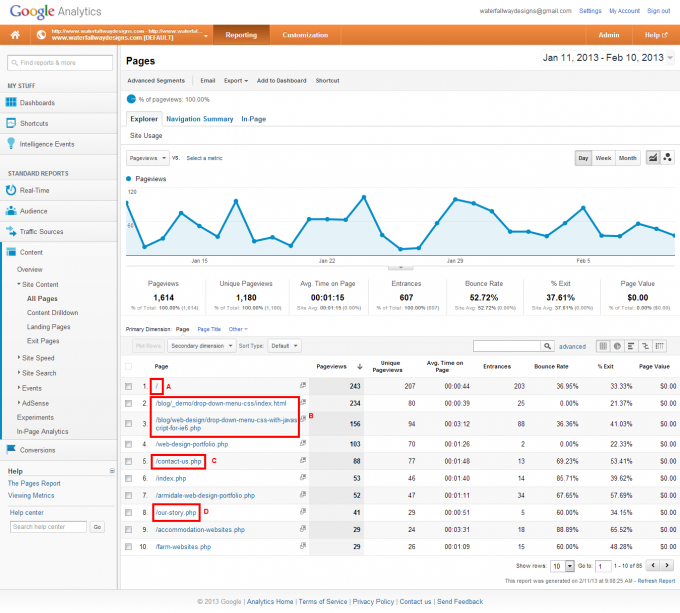
Content
This report shows you exactly what pages people are looking at.
Content -> Overview -> Then in the bottom right hand corner of the page I click "view full report".?
A: Home page - this forward slash refers to your home page and is commonly the most looked at page.
B: Blog pages - these two pages are from my blog. This is the web design section where I talk about my industry and ways to do things. Now this section is not really for my clients. It is for other website professionals to have a look at how I do things. I have included these sort of articles to be seen by Google as a web design professional. If other website designers are reading and linking to my blog then my website becomes better in Googles eyes.
So in the last month 94 individuals looked at my page on drop down menus and stayed for over 3 minutes.
C: Contact us - I think it is always good to see people reaching your "contact us" page. The only thing on that page is my contact details.
77 people looked at it in the last month, staying for over 1 minute.
D: Our Story - This page is a personal, profile sort of page. That has photos of us and our story. It is interesting to see it here. 29 people looked at it in the last month. So for me it reaffirms the importance of this page. People are interested in knowing a little bit about us and who they will be working with.
So you can see how this report will guide how you add content to your website and change existing content. You can change your website on the fly, with our custom made content management system, to cater to the needs of your customers.
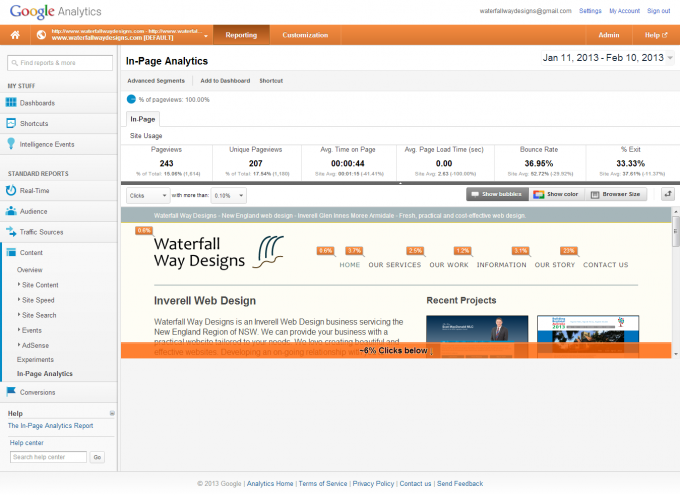
Content - In Page Analytics
One final beginners? report from Google is the "In Page Analytics".
Content -> In Page Analytics
This report shows you visually when a visitor is on a page where they go. For example if a visitor is on the home page what percentage of visitors then click the Contact Us page. It is insightful to see the behaviour? of people visiting your site. You can also click through to the next page and see a report for that page.
Conclusion
That is the basic Google analytics reports, you can start exploring other more advanced reporting. Google has a lot of good online support for these reports. So if you have any questions, please check out Google Analytics Questions.
Next Steps??
For existing clients, if we have not set you up with access to these reports, please contact us.? Think about your business and what you would like your website to do for it.
For people who are not our clients, why not partner with us to improve your online presence?. Have a look through this website and get in touch today.